Mechanical
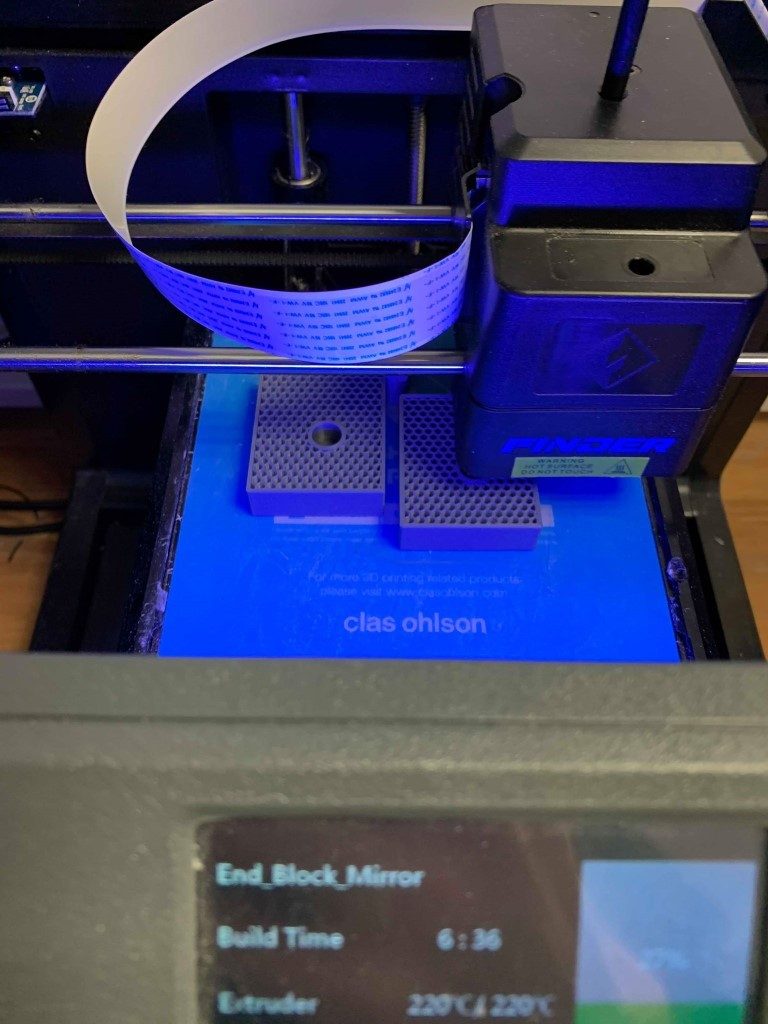
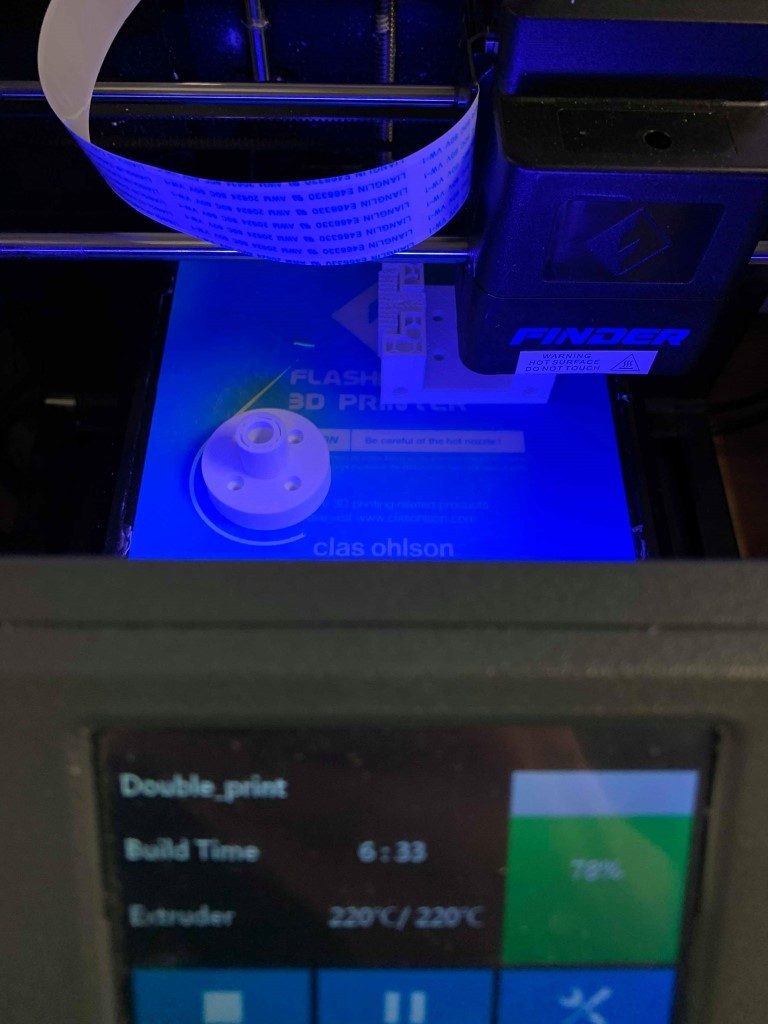
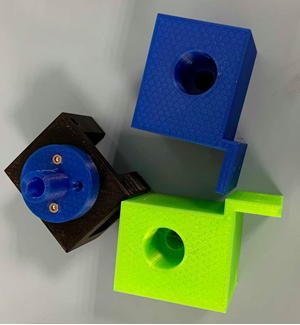
This week the mechanical group has made a lot of progress regarding the production of the different parts that needs to be 3D printed. We have made different versions of the same parts to see that they fit and made adjustments thereafter. There is not that much to write about this week since we’ve more or less been creating the same parts this whole week.
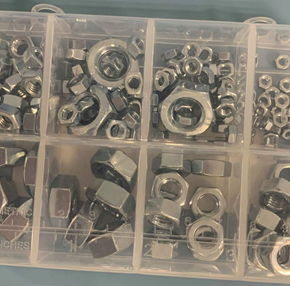
We have needed to supply ourselves with additional components that USN doesn’t have. There are not too many different bolts and nuts in the workshop, which leads to less freedom when designing different parts. Therefore, we have purchased the following components:
Also, the pipes we had equipped from the workshop somehow got really bent. Therefore, we needed to equip some new ones and went to i-senteret and bought two new pipes.

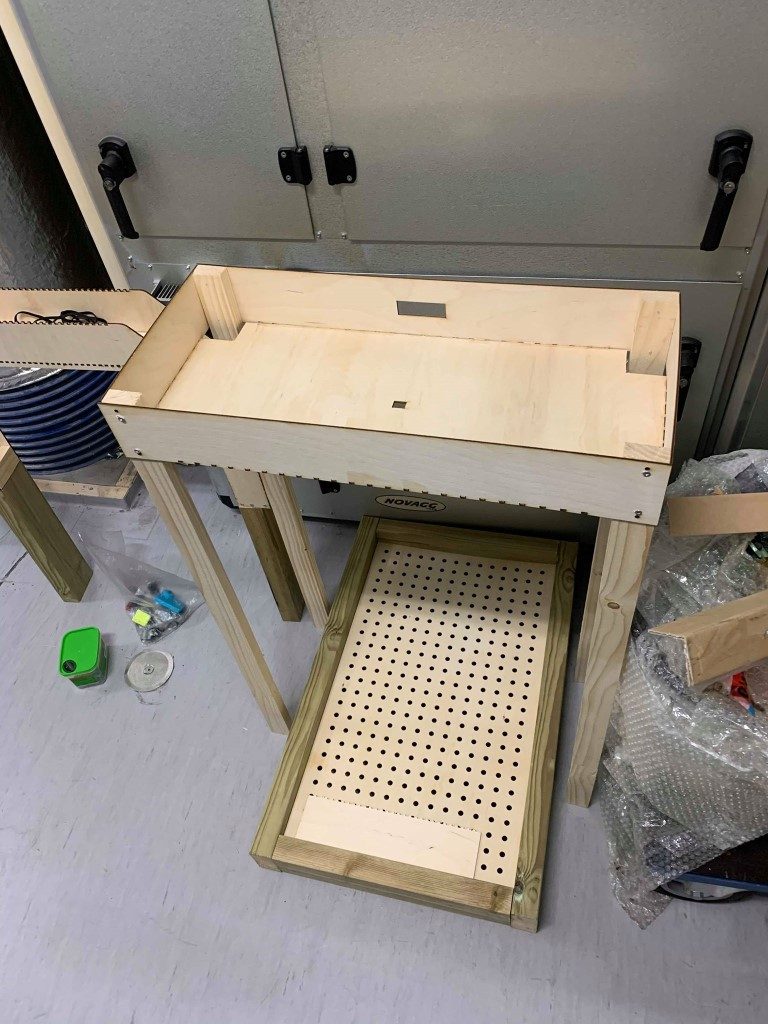
Also, we have made a new and higher bridge for the camera, so it gets a view of the whole board, and a cut out of the score screen. We made it a bit bigger than the previous version so that we can store the electrical components in a better manner than previously planned.
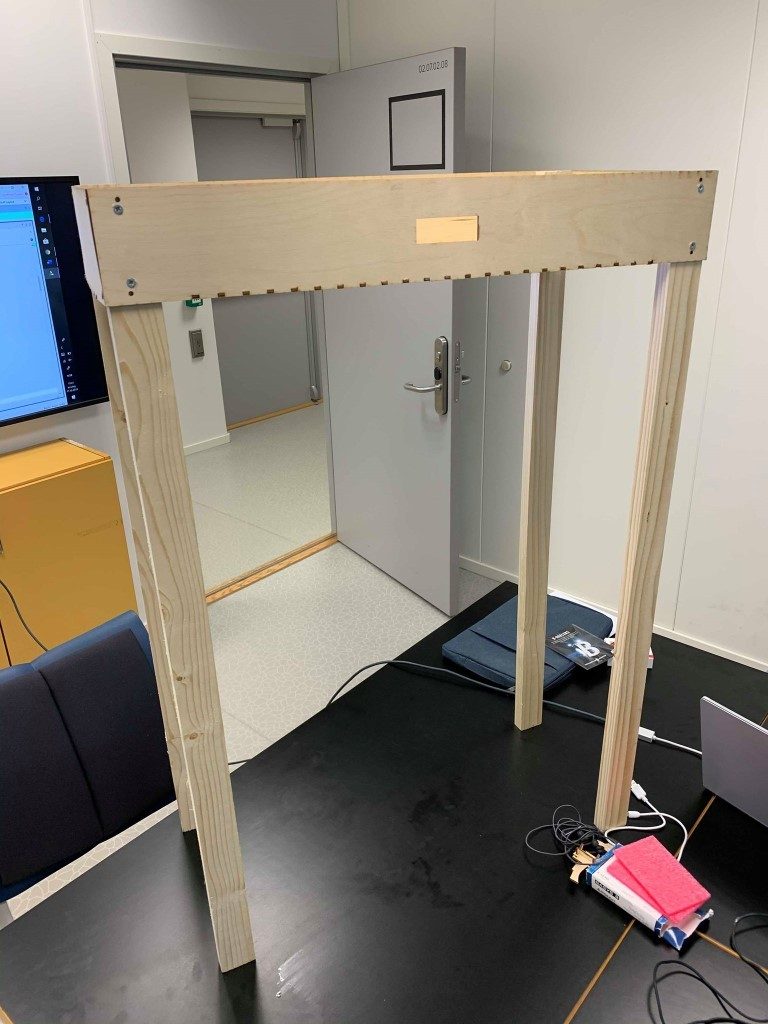
We needed to make it a bit wider than the board so that it doesn’t get in the way for the band. This will be more visual when the system assembly has got a bit further than now.
Electrical
This week we’ve managed to get almost all the components that we need for electrical part. Afterwards we programmed the sensor sender and receiver. The receiver is responding to intensity of a light, so when the sender(laser) is directed to the receiver, the intensity is the strongest. For score counting the sender is always sending signal (light) to the receiver and when the laser ray is cut by the disc (hockey puck), that means we scored a goal and the points increase by one.
We’ve also connected and programmed the Liquid LED screen for showing us the score and time we’ve got left until the end of the game. First, we had to connect a potentiometer in between so we could set the proper background lightning of the screen. Without it we are not able to see if the screen actually working. At the end we connected sensor and liquid screen so they work together as it should at the end.
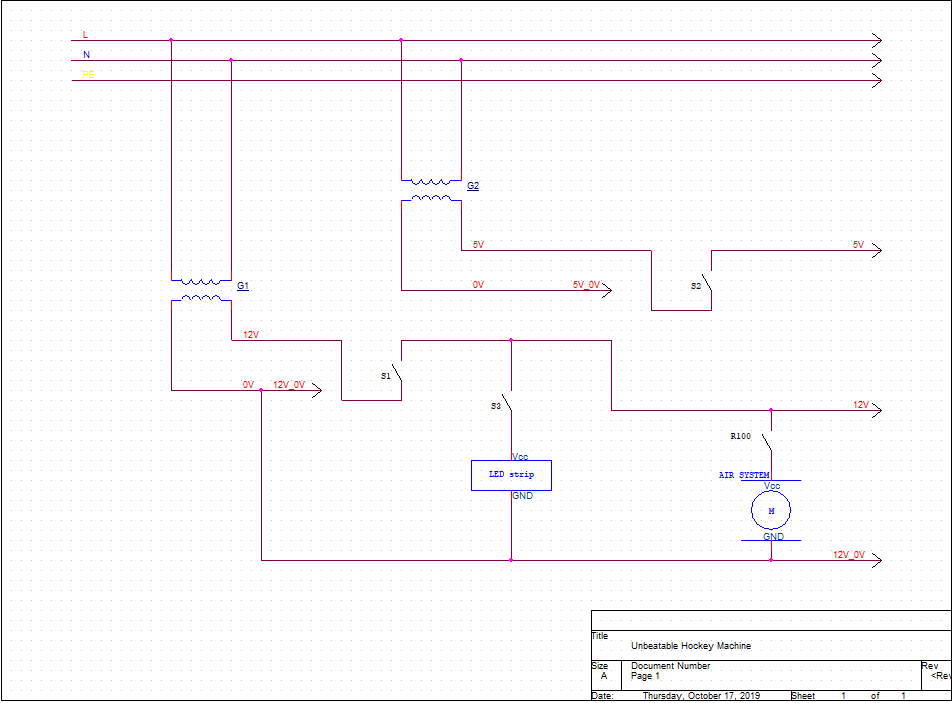
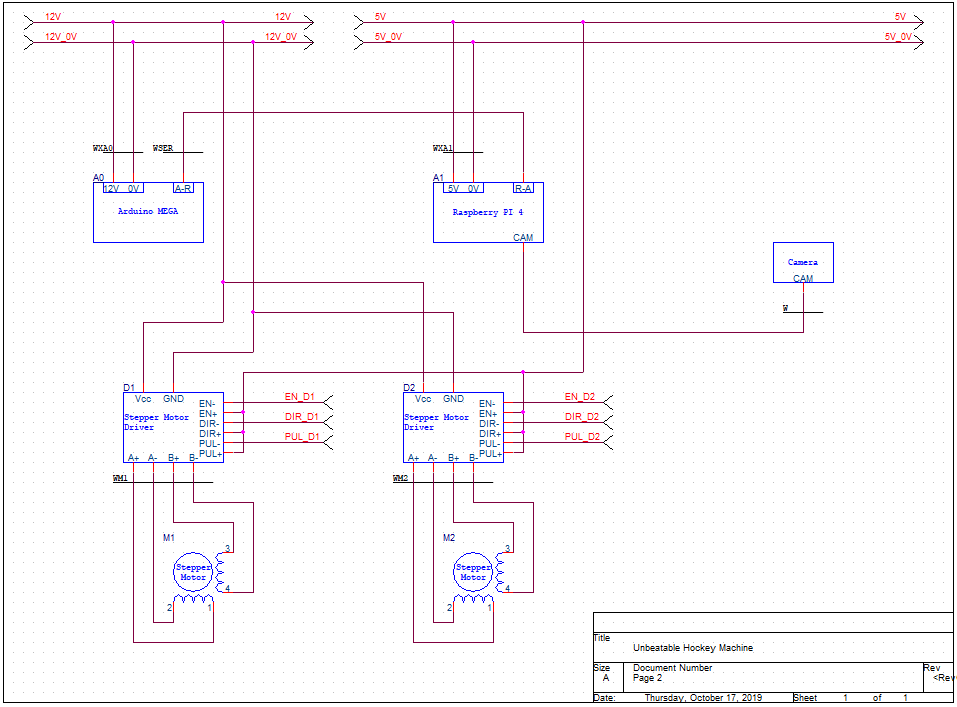
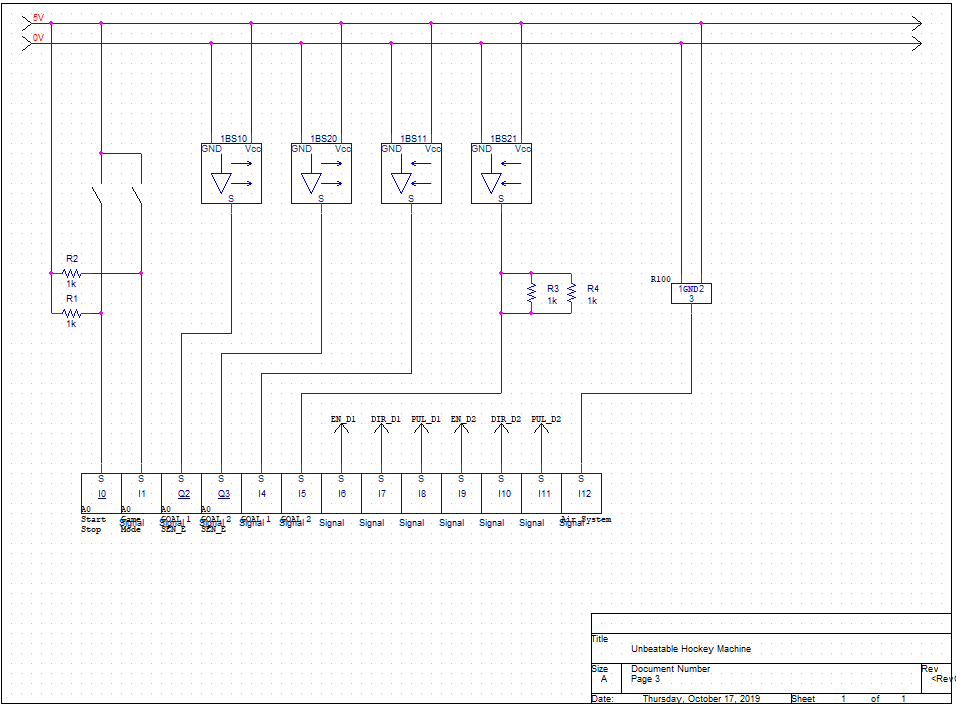
The schematic of electrical power supply was also finally made, because we’ve managed to get a license for a proper program to work in. This schematic is completed for Hockey Machine Prototype that we have now, but it might change a little at the end if we’re going to add some things to it later on.
Computer
Similarly to the last couple of weeks, we have continued to divide our resources between the performance problems and the program. Whereas one of us began running tests to determine the necessity of the cooling fan we purchased, the other attempted to research and implement the improvements suggested by Steven last week.
In an effort to simplify and optimize our program, we have looked into the suggestions from Steven last week.
Our first step was to implement a FPS counter to better determine the performance of our program. This was a simple matter of dividing the number of frames up until a certain number of frames (e.g. 30) and divide that by the total amount of time it took to process those 30 frames, and repeat this process every 30 frames.
We also made several different versions of our program, stripped down to only the color space operations, to determine exactly what functionality was most resource-intensive: one version with raw webcam footage, one version converting to HSV color space, and one version where we retain the default BGR color space. These tests were performed on the weaker raspberry pi 3, so we will have to run these tests for the raspberry pi 4 as well. For each of these versions, the FPS was 41, 23, 32 respectively, suggesting the BGR to HSV conversion takes about 10 FPS. Subsequently, we did the same comparison between BGR and HSV, only this time within the entirety of our program. As expected, with BGR we got 17 frames, and with HSV we got about 8 frames, which is consistent with our earlier tests where this conversion took 10 FPS.
Furthermore, we discovered that our angle calculation functionality was rather demanding, and when not used, we went from 8 FPS to 13 FPS using the HSV color space. The rest of the functionality of the program we have not been able to test without, as these are currently necessary to make the program work in the first place.
Unfortunately, using HSV may be necessary after all. After much testing, it appears that the inherent sensitivity to light when using the BGR color space is too prone to present problems. We made a program where we can define the color ranges of the mask in real-time (using openCV trackbars) to create the best mask possible, and when our object was exposed to slightly more light when we used the BGR color space, the program could no longer track the object. Meanwhile, doing the same test with HSV, the program was still able to track the object reliably. Perhaps we could use BGR if we were very certain of the lighting conditions, and that these would never change, but HSV seems to be more robust.
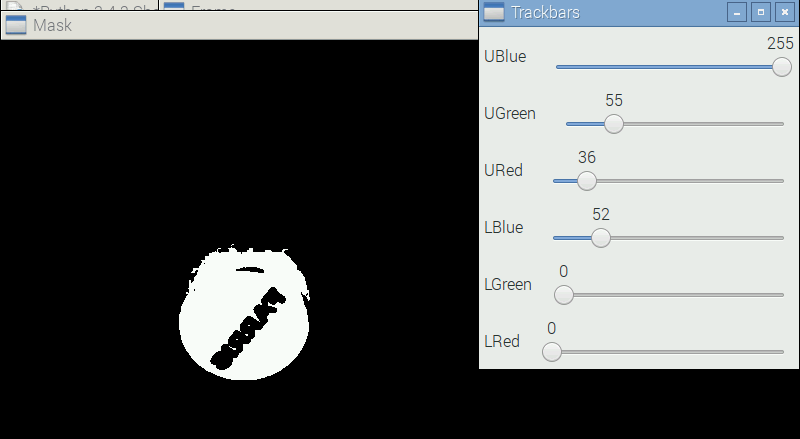
Using trackbars made testing far, far easier, as we could see in real-time how to best adjust our mask for any given condition; in the image above this is done for BGR, but could just as easily be implemented for HSV. Using trackbars, we may be able to define a color range for the final product that allows us to use BGR, provided the light will be static and uniform enough.
That being said, we were able to optimize the program by removing some seemingly unnecessary algorithms (such as gaussian blur, distortion, erosion), which resulted in a slight performance gain. Moving forward, we will need to find out how we can simplify the program even further; Steven suggested we didn’t need to find the contour to find the centroid (although from our research, this appears to be the most conventional method of doing it?), so we will need to do some more research and experimentation in an effort to optimize our program even more.
Addressing the heating issues, this week we received the cooling kit for RP 4 and did some testing and monitoring of the processor temperature and thermal throttling. Even though we were pretty sure that the cooling system was a must for the new Pi from the research and different articles we read on the subject, we decided to take Steven’s advice and do some testing of our own – not only to verify that the processor was in fact overheating when running our program but also to test and verify that the new cooling system solves the throttling issue.
From Raspberry Pi foundation we know that when the Pi 4 heats up beyond 80°C, the clock frequency is reduced and the CPU is throttled to reduce the temperature, which in turn decreases the performance. We first noticed this condition when compiling the OpenCV from source and a half-full red thermometer appeared on the display (pictured below)The icon is an overheating warning which also appears on the screen when running our program without cooling.

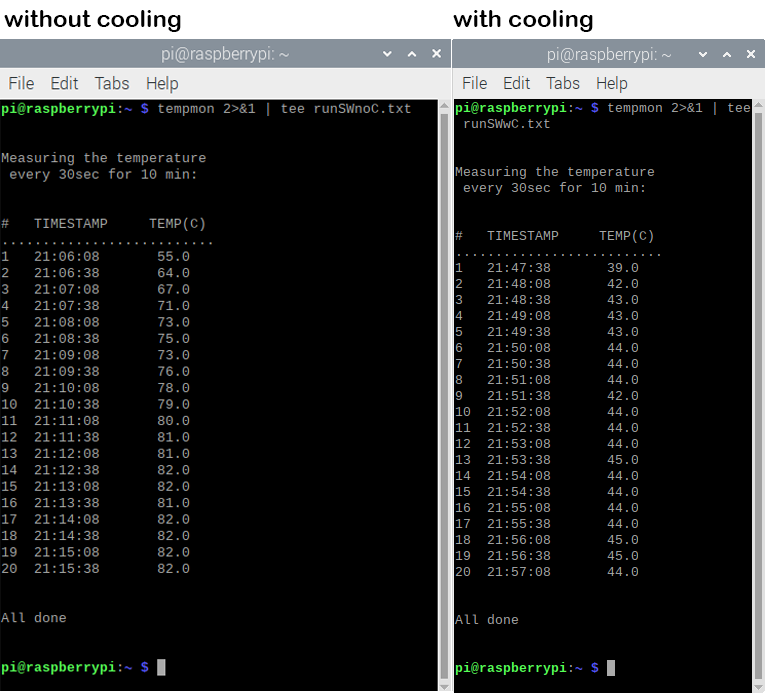
Following Bash Script was written to measure and monitor processor temperature every 30 seconds for 10 minutes.
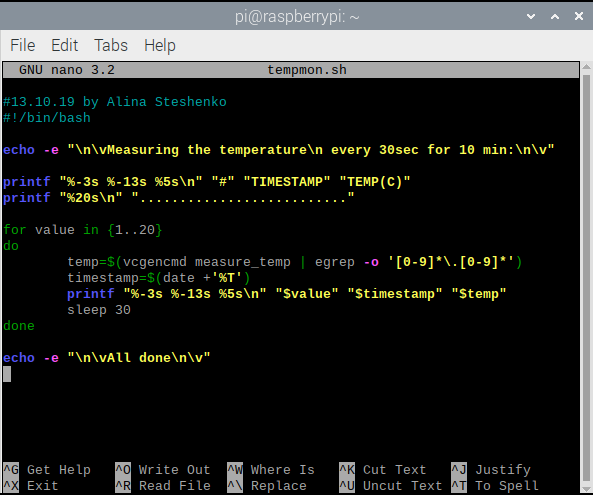
tempmon runs it like any other Linux command. We outputted the data stream with the results to the terminal window as well as to a file for easy graph plotting later on.
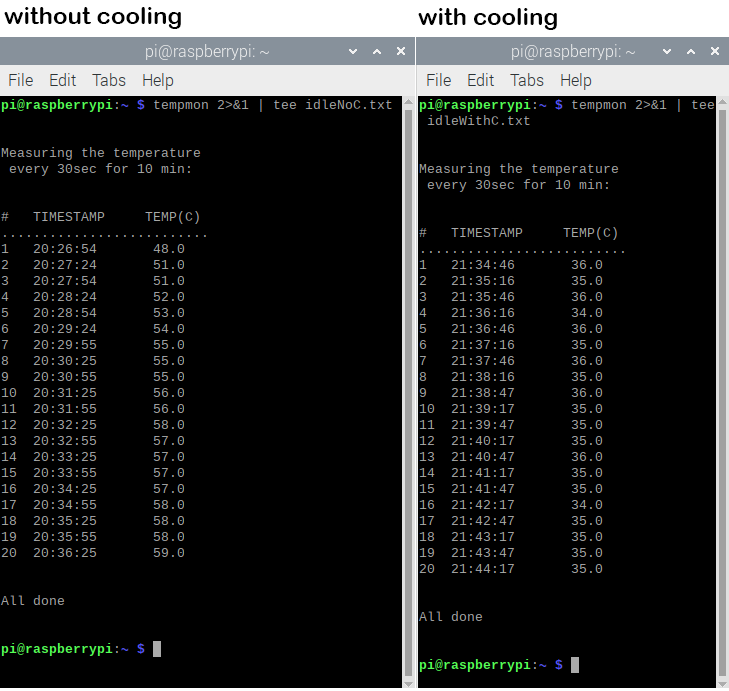
Here are the results from monitoring the core temperature while in idle state and while running our program, without and with cooling respectively:
The results visualized in a line chart:
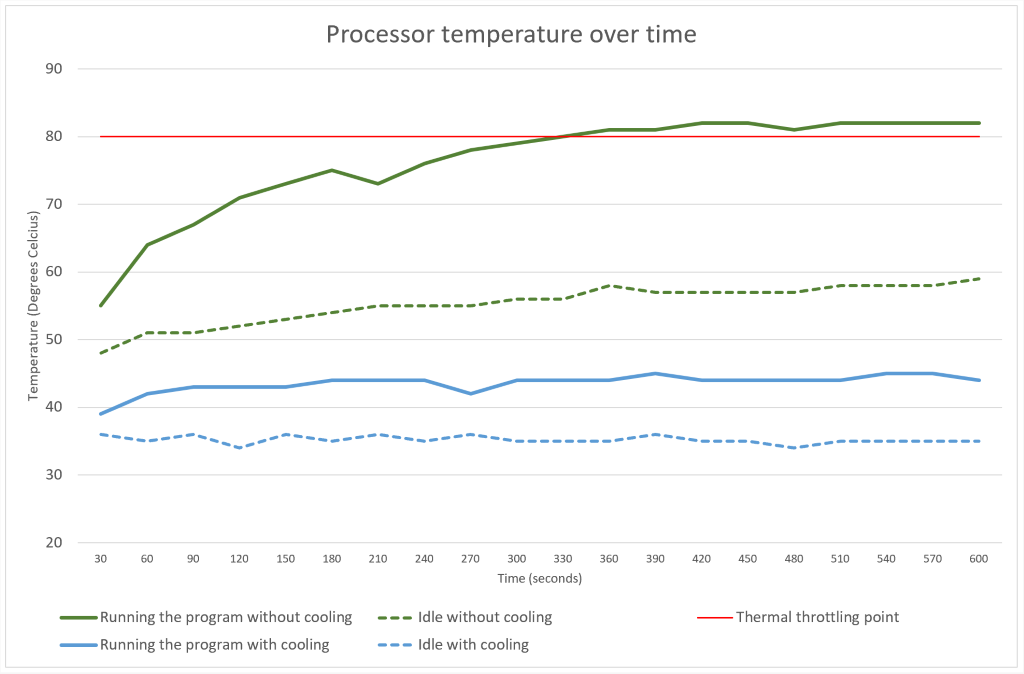
We are especially interested in the results while running the program. First of all, this confirms our assumption that the processor gets overheated and needs cooling. As you can see after approximately five minutes of running the program right after booting up the OS the temperature rises above 80°C and CPU is throttled.
The core temperature almost halved after the heat sinks and the cooling fan were installed. It stabilizes at about 45°C and stays there through the first test. We did run an additional test for another 10 minutes right after to confirm that the temperature remained the same (the results from the second test are not included here to avoid redundancy).
This concludes the thermal testing and confirms that the purchases of the cooling system was indeed a good investment.