ign topic -i /model/vehicle_blue/odometryAugust:
Implementing IMU for Autonomous Car
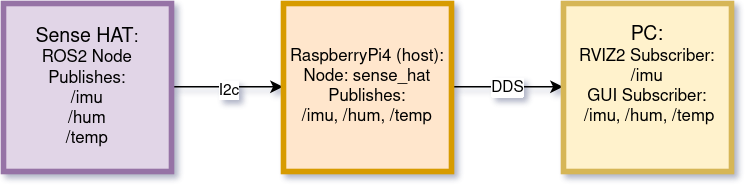
Finally, everything is ready! This week will be like shark week on Discovery Channel, just instead of sharks, there will be autonomous cars. This will be frickin awesome. I have done a lot of research. I will use this github repo: https://github.com/adityakamath/sensehat_ros. This have everything we will need. We will use the IMU later for mapping. Sander is going strong on making the LiDAR work, and we will collaborate later on to make the car fully autonomous. The Ultrasonic Sensor is more or less ready. For the autonomous driving we envision, we need IMU data and LiDAR. The car will after future iterations do mapping and A*.
IMU – Iteration
The goal of this iterations is to get IMU data visualized in RVIZ2 the RPI4 Sense HAT moves. With the github repo I mentioned above, we will get the ROS2 node and topic to be able to do this. We will see if it is plug and play. Time will tell.
I started of course by cloning the repo in /ros2_ws/src
git clone https://github.com/adityakamath/sensehat_ros.gitI then built the workspace and sourced the files. The code uses clpy.qos.qos_profile_sensor_data to be able to deal with high frequent sensor voltage.
I then launched the node:
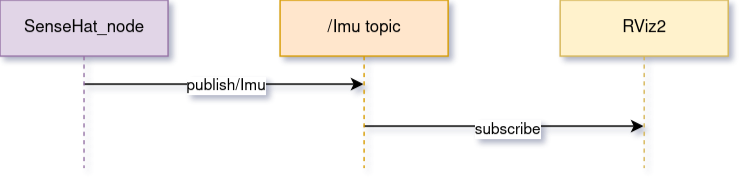
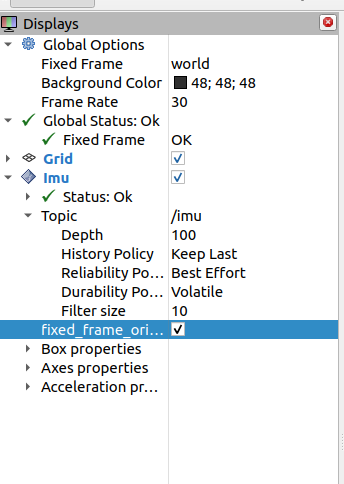
ros2 launch sensehat_ros sensehat_launch.pyI checked the ros2 topic list, and the topic was up. I veryfied that the node was publishing, by doing ros2 topic echo /IMU. Everything worked well. I then wanted to try to see the visualization in rviz2. I Opened rviz2, and added /IMU, but nothing happend. The terminal said:
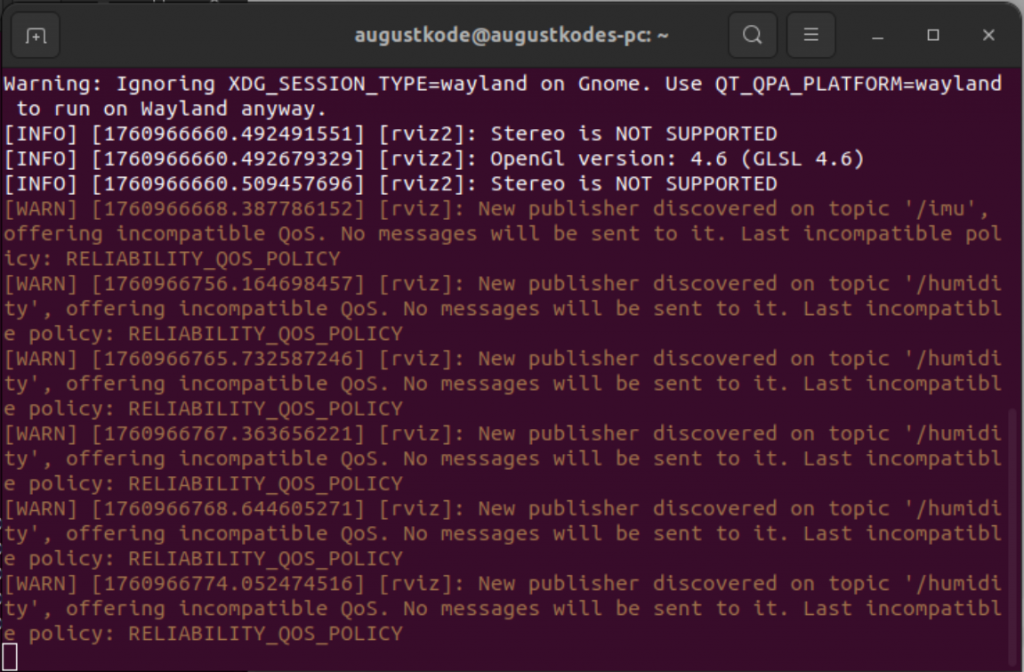
This happend because the default reliability policy was set to reliable, but the code demanded best effort. After fixing this, I was challenged by the next task. I was in the wrong fixed frame, and because of this, I recieved this message in the terminal:
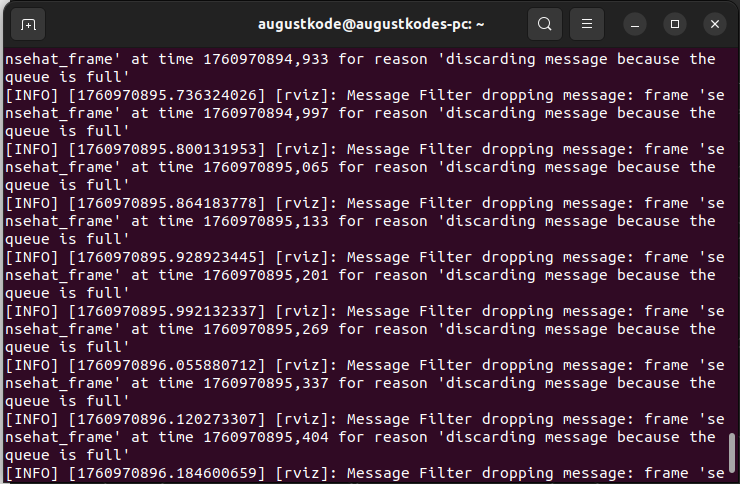
After realizing this i tried to move around the RPi4. Nothing happend. When i pitched, roled og yawned the RPi4, nothing happend. This was fixed by:
ros2 run tf2_ros static_transform_publisher 0 0 0 0 0 0 world sensehat_frame
Without this, there will be no movement when trying to visualize IMU in rviz2. This took some time to research, but find this: https://docs.vulcanexus.org/en/jazzy/ros2_documentation/source/Tutorials/Intermediate/Tf2/Writing-A-Tf2-Static-Broadcaster-Py.html.
When I did this, I had movement! Wohooo! This was a milestone, because getting here took quite some time. The problem here, however, was that the z-axis was turned upside down. I realized that it was becausethe tf2 was set 0 0 0 0 0. I had to type 0 0 0 0 3.14159 0. After doing this the axis was the right way. The best one was ros2 run tf2_ros static_transform_publisher 0 0 0 3.14159 3.14159 0 world sensehat_frame
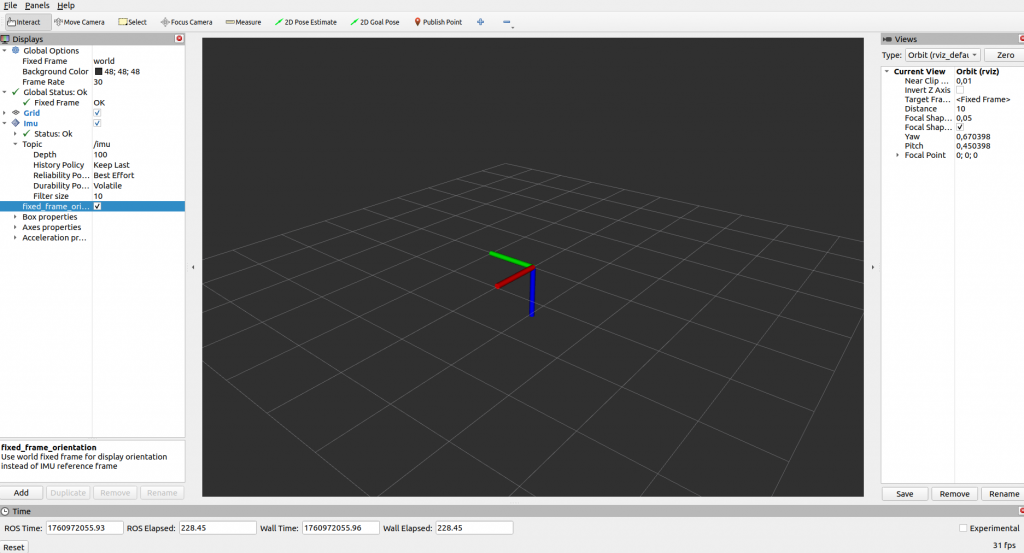
Now my display looked like this:
Now, the next problem was that the y-axis yawed, and the z-axis rolled. I had to go in to code, and change the order of which they where implemented. By changing yaw and roll, it was corrected.
The next issue was that the y-axis roled the opposite way of how i roled the RPi4. I had to go into the code, and remove the – in front of the y. After doing this everything worked.
Done with the IMU data, and visualize it in rviz2! By completing this, I felt like Tony Stark. If Tony Stark had no charisma, girls, money and less technical skills. This is a great step on the way to mapping and A*!
Making the Gui Great Again – MOST INSANE GUI ITERATION SO FAR
Its time to get everything tied together in the GUI. At least the data from the Arduino, the IR ZeroCam and the /driving_mode topic. I wanted to really optimize everything. I have done a lot of research, searched for hours. The results? Satisfying!
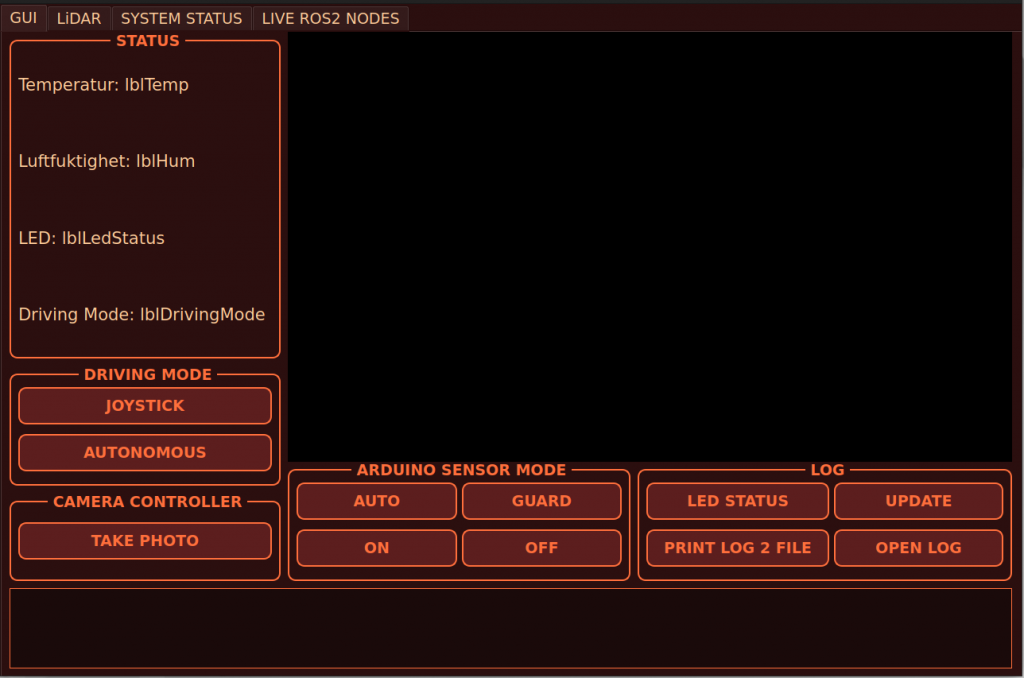
I removed a lot of the placeholders from last week. I want it more clean, and that the data displayed is useful. I also want the GUI more functional, and that it is easy to see if the nodes are connected or disconnected. This is the most clean the gui has ever been. I removed all unnecessary complexity. I gave it my all, and this is how the design looks like (for now):
I started her: https://docs.ros.org/en/foxy/Tutorials/Beginner-Client-Libraries/Writing-A-Simple-Py-Publisher-And-Subscriber.html?utm_source=chatgpt.com. And: https://docs.ros2.org/foxy/api/std_msgs/msg/String.html?utm_source=chatgpt.com. And of course: https://docs.ros.org/en/humble/Tutorials/Beginner-Client-Libraries/Writing-A-Simple-Py-Publisher-And-Subscriber.html?utm_source=chatgpt.com. If there is a god, this is him: https://github.com/adityakamath/sensehat_ros/blob/humble/README.md. https://docs.ros.org/en/foxy/Concepts/About-Executors.html
Displaying in GUI
The first thing I wanted to start with was the pressure data provided by the Sense HAT. The reason why is because I just had validated that the /pressure topic existed, and that the Sense_HAT_node published to it. This is the code I started to implement her, and I reused it later https://docs.ros.org/en/humble/Tutorials/Beginner-Client-Libraries/Writing-A-Simple-Py-Publisher-And-Subscriber.html?utm_source=chatgpt.com#write-the-subscriber-node, https://gist.github.com/robosam2003/9e8cb1d8581ddd3af098a8813c64e71e, https://github.com/tasada038/pyqt_ros2_app/blob/master/README.md. (I have used more sites as well, they are all listed in the code):
pressure_signal = pyqtSignal(float)

self.pressure_signal.connect(self.update_pressure_label)

def update_pressure_label(self, value):
        self.lblPressuseSenseHAT.setText(f"Pressure: {value:.1f} hPa")

self.pressure_subscription = self.create_subscription(
            FluidPressure,
            '/pressure',
            self.pressure_callback,
            qos_profile=qos_profile_sensor_data
        )

def pressure_callback(self, msg: FluidPressure):
  pressure_hpa = round(msg.fluid_pressure / 100.0,1)
  self.get_logger().info(f"Pressure:{pressure_hpa} hpa")
  self.interface.update_pressure_label(pressure_hpa)
  self.interface.pressure_signal.emit(pressure_hpa)
The whole idea here is to have a GUI node that can manage and display data and components within in the sytem. I wanted to display the pressure data in the lblPressureSenseHAT, but I met big challenges:

Thankfully this was similar to the challenge from getting the Sense HAT visualisation in rviz2. I had to switch policy. https://docs.ros.org/en/humble/Concepts/Intermediate/About-Quality-of-Service-Settings.html. In the code aboq the qos_profil=qod_profile_sensor_data is the policy that was needed, I replaced 10 for that. Where 10 was the reliabilty policy, we now have the best effort policy.
I have done some research on QT graphical view: https://www.pythonguis.com/tutorials/pyqt-qgraphics-vector-graphics/?utm_source=chatgpt.com.
Now I reused this code, and fixed the same for temperature, humidity and made a publisher.
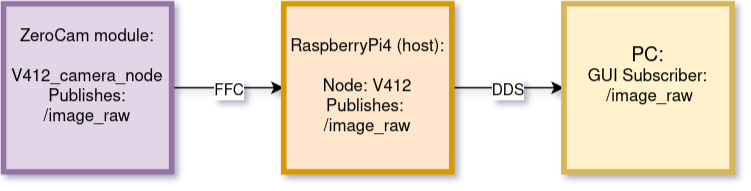
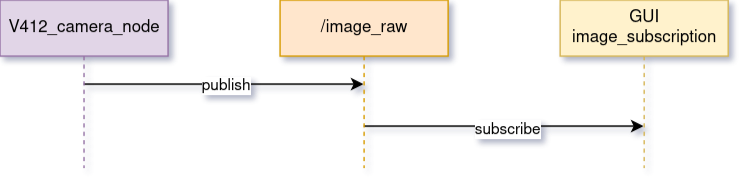
Making the Camera a ROS2 Node
I did some research here, and discovered V4L2, https://docs.ros.org/en/humble/p/v4l2_camera/. I had to install and initalize the ROS” driver for V4L2:
sudo apt update
sudo apt install ros-humble-v4l2-camera
Starting the node
ros2 run v4l2_camera_nodeThis publishes sensor_msgs/Image on topic /image_raw. I then tested if I had a video feed:
ros2 run image_view image_view --ros-args image:=/image_rawThis opened a window with a live-feed from the camera. At this moment i knew thtat the ROS2-topic worked, and I was a bit happy and relieved.
I had to use rclpy for ROS”-communication
cv_bridge + OpenCV in order to convert from sensor_msgs/Image til QImage.
And the same PyQt5 signal for secure threading of updates in the GUI.
Screenshot: https://stackoverflow.com/questions/10381854/how-to-create-screenshot-of-qwidget bilder med pixmap
Displaying Readings of RPi4 Processor Temperature
I did some research and found this: https://github.com/Infinite-Echo/ros2_temperature_tracker.git. I then:
cd /ros2_ws/src
git clone https://github.com/Infinite-Echo/ros2_temperature_tracker.git
cd ..
colcon build --symlink-install
source install/setup.bash
I then struggled a bit to get it working. The problem, however, was that my RPi4 used a different zone name. On my RPi4 it is cpu-thermal. After changing this, the node published on /cpu_temp fine! I then did the same process as listed inn pressure, and it got displayed in the GUI.
Driving_mode topic
This topic makes it possible to control and monitor the driving mode form the GUI in real-time via ROS2. https://docs.ros.org/en/humble/Tutorials/Beginner-Client-Libraries/Writing-A-Simple-Py-Publisher-And-Subscriber.html?utm_source=chatgpt.com, https://gist.github.com/robosam2003/9e8cb1d8581ddd3af098a8813c64e71e, https://www.pythonguis.com/docs/qpushbutton/?utm_source=chatgpt.com. The subscriptions was the same as the procedure in pressure. The buttons and the publishing node:
self.driving_mode_publisher = self.create_publisher(
String,
'/driving_mode',
10
)
self.btnControlDrivingMode.clicked.connect(self.set_joystick_mode)
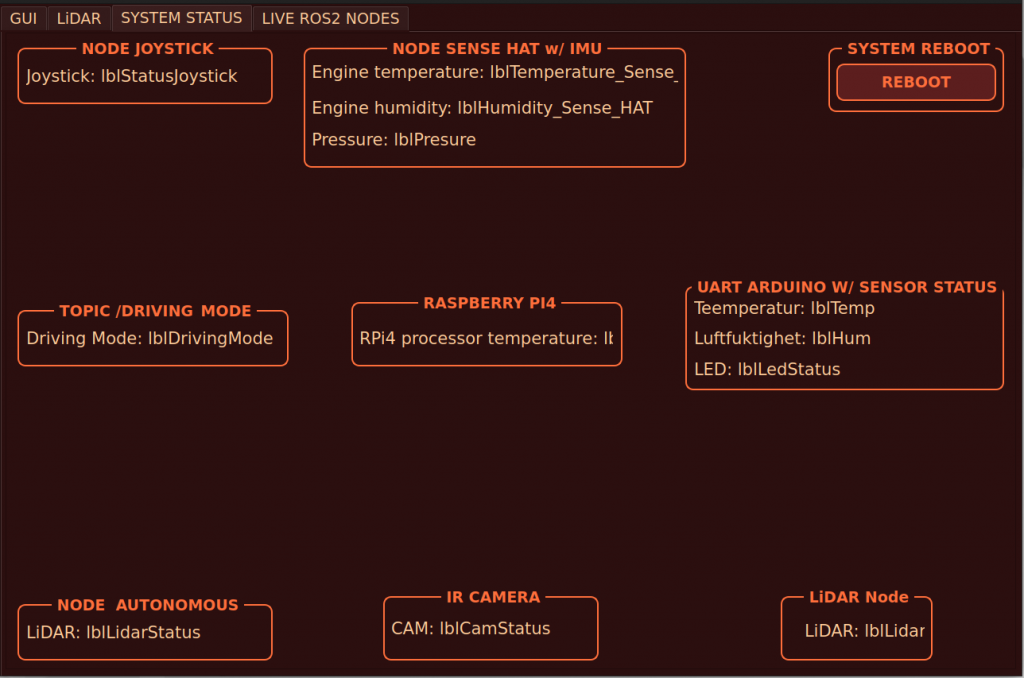
self.btnAutonomousDrivingMode.clicked.connect(self.set_autonomous_mode)Demonstration of GUI:
Everything I have started on this week is completed. Im happy with the results!
This has been an extremely productive week.
Next week
- GUI: Give the ros2 nodes in System Status, red color if they are disconnected or green if they are connected.
- GUI: I want to implement rviz2 in the GUI
- GUI: implement filepath with directorate fir pictures
- CAR: continue on the road to autonomous driving
- CAR: look at the physical components with Sander
- ARDUINO: implement fire module
Sander
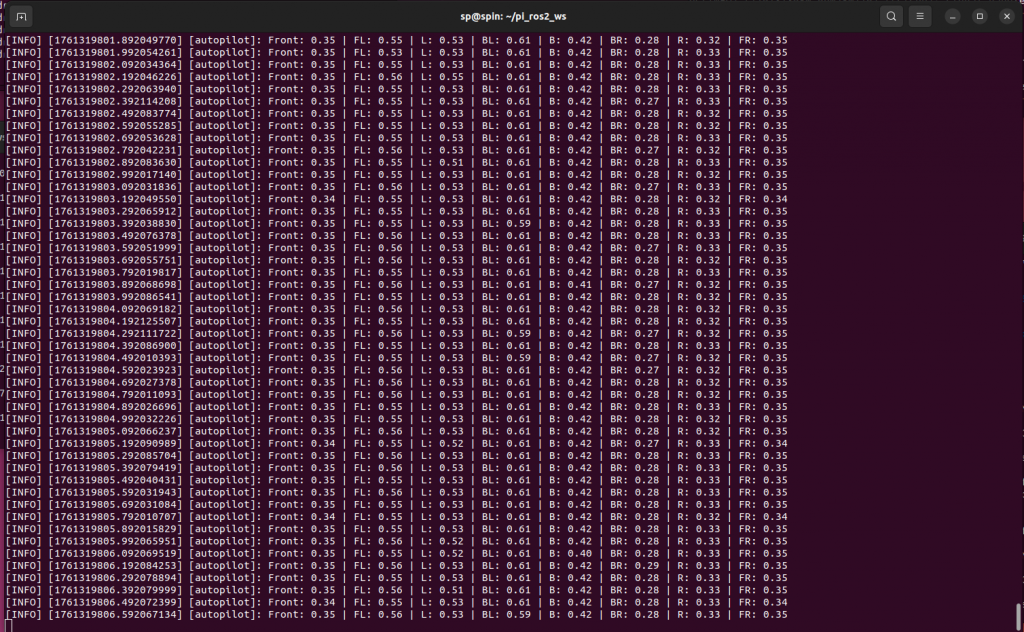
This week I tested the new-made rover to see if it drove the way it should, and it looks like August and me mounted the wheels correctly as the mecanum driving characteristics is working flawlessly while using the joystick. There was some power problems when using the USB output of a laptop when running the car, probably due to the increased weight and resistance for the motors. This was solved by getting a 3M USB to USB extension cable so the DFR driver board could be powered from a wall outlet using the RPI OKDO 5V adapter. This resulted in the car being smooth and powerful with no issues. The longer cable also simplifies the testing of the rover, as we no longer have to walk by the rover with a laptop attached to it during testing. The RPi is powered by a standard 20,000mah USB power-bank, and only draws approximately 4,5W at 5.1V.
To get started on the autopilot node, I divided the lidar into 8 sectors to get 45 degree sectors, in the same way as the cars movement, Forward, Left-Right, Right etc. Created a simple print program to check if the directions was correct and the readings were good. This method provides a simple collision avoidance logic that uses rover_frame to take decisions based from the rovers perspective, and issues simple control commands to the micro-bit to turn the rover if a object appears in its path. This was more of a learning experience than it was relevant to our project, since we want to use SLAM to map and navigate using the global frame transformed from the car using IMU data, instead of the relative frame of the rover.
auto min_range = [&](size_t start, size_t end) {
    auto begin = msg->ranges.begin() + start;
    auto finish = msg->ranges.begin() + end;
    auto it = std::min_element(begin, finish, [](float a, float b) {
        if (!std::isfinite(a)) return false;
        if (!std::isfinite(b)) return true;
        return a < b;
    });
    return (it != finish) ? *it : std::numeric_limits<float>::infinity();
};
This is a lambda function used to get the minimum values for the lidar readings it goes through the ranges[], from the laser_scan message. The begin and end parameters are used for checking different sectors independently. Its using std::isfinite() to filter out error readings. Finding the smallest valid reading.
I also tried to get the slam_toolbox to work with the simulation in gazebo that I made last week but I didn’t get it to work. as im having some issues with the ros2 bridge that is supposed to publish data from gazebo to ros2. Next week I will probably just try to get it to work on the rover as I will get my hands on the sense hat.
Sondre
Transition to Qt
This week started with downloading the necessary software for our “Dashboard,” which will serve as the GUI for the ground station. The plan is to have a simple ground station with a touchscreen that displays the dashboard. I have also moved away from WSL and now work directly in Ubuntu due to a lot of issues with WSL.
About Qt
Qt is a framework for creating applications with graphical interfaces in C++ and QML. The reason I chose Qt is because it gives us a fast and responsive GUI, has good support for the touchscreen I’m using, and makes it easy to integrate with C++ code.
Qt uses QML for the actual UI design that the user interacts with, and C++ classes for the underlying logic.
Qt and ROS2
The GUI itself functions as its own ROS2 node, which means it can subscribe to other topics and use the data directly. The goal is to eventually subscribe to the topics the rover publishes and display them on the screen.
Code Structure
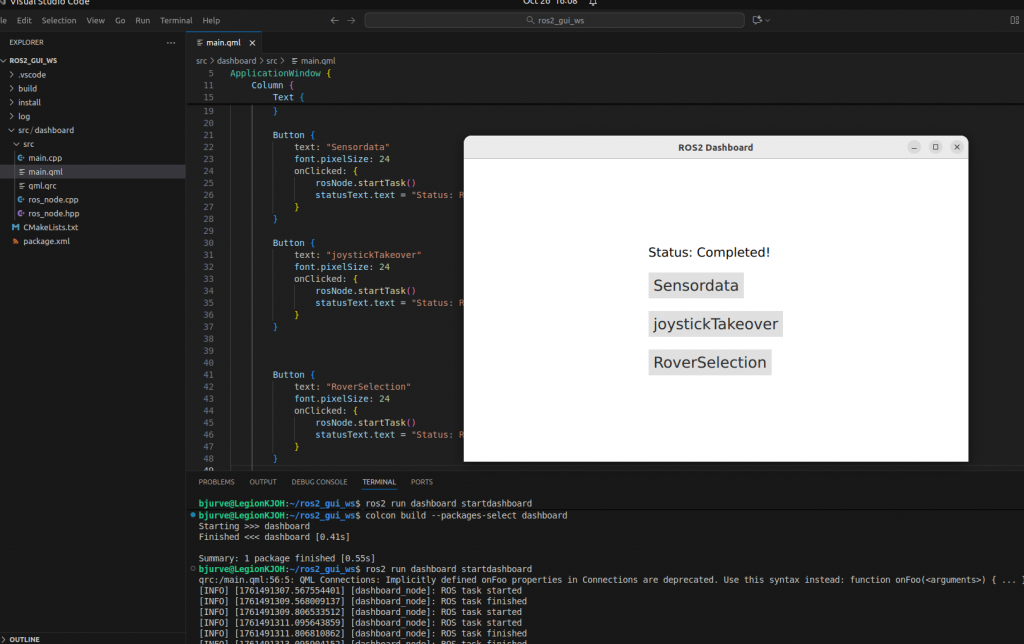
The GUI project is organized in a simple and clean file structure where each “package” or any future ROS nodes can be created under “src”. For now, I only have the dashboard, as you can see in the picture below. The dashboard program consists of the files located under /dashboard/src/, which I briefly explain below.
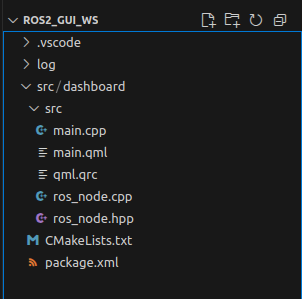
Main.cpp
Main.cpp starts the entire program. It initializes the Qt application, connects the ROS2 functionality, and exposes RosNode to the QML side so the interface can access the C++ logic. Finally, it opens main.qml, which defines the GUI layout.
ros_node.hpp / ros_node.cpp
Here, RosNode is defined and implemented for the GUI to use. This class handles publishers, subscribers, callbacks, and runs ROS spinning in a separate thread so the GUI doesn’t freeze. It acts as the bridge between sensor data from the rover and the GUI.
main.qml
In this file, the actual layout of the GUI is defined. This is where the dashboard’s appearance is designed. Here I create buttons, windows, and displays for sensor data.
qml.qrc
This file registers and makes the QML files available to Qt. It allows the GUI to be packaged and run as a single application on the Raspberry Pi.
The image below shows a first draft of the dashboard, where I have added some buttons that do not do anything yet. Eventually, I will also add a separate window that displays sensor data from the rover.
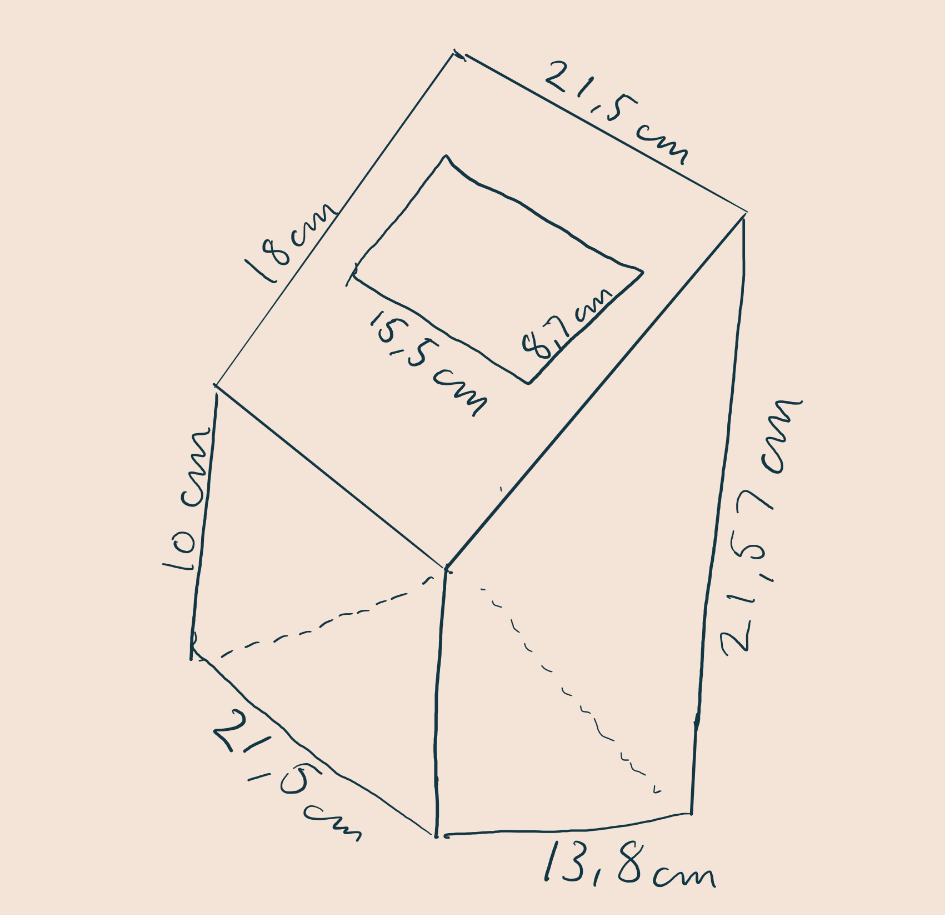
I also sketched a rough design of how the ground station should look. The plan is to bring this to Richard next week to finalize it and hopefully get it 3D-printed.
Plan for Next Week:
- Talk with Richard about the ground station and possible 3D printing
- Talk with Steven about the touchscreen and GPS
- Improve the GUI code
Oliver
This week, I unfortunately haven’t been able to work much due to health-related reasons. The LiDAR belt has arrived, and I’ve replaced it. I tested the code, but there are major calibration errors that I’m working on fixing. However, I did manage to resolve other issues, such as missing data packets